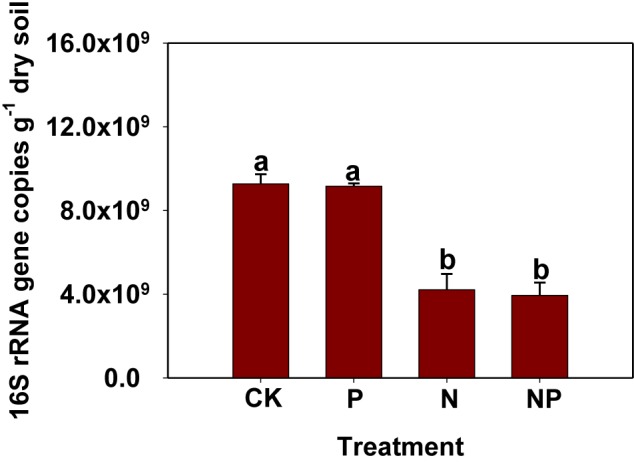
FIGURE 1.

Abundance of bacteria as indicated by 16S rRNA gene copies examined by real-time PCR. Same letters above columns indicate no significant difference (p < 0.05). CK, no fertilizer; P, phosphorus input; N, nitrogen input; NP, nitrogen and phosphorus input.
