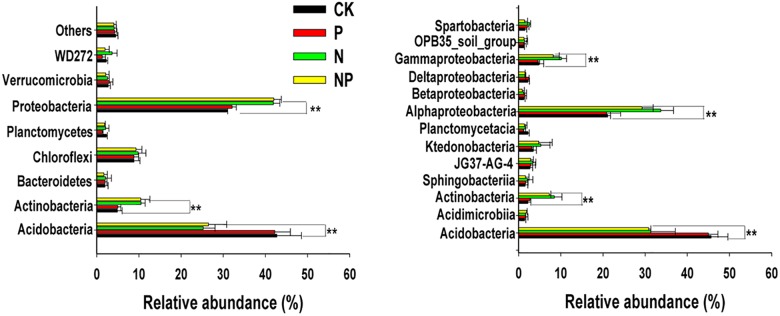
FIGURE 4.
Relative abundances of the most abundance bacterial groups in different treatments at the phyla (A) and class (B) levels. Others represented unclassified groups. Data are means ± standard deviation (n = 4). Significance is indicated by ∗∗p < 0.01. CK, no fertilizer; P, phosphorus input; N, nitrogen input; NP, nitrogen and phosphorus input.

