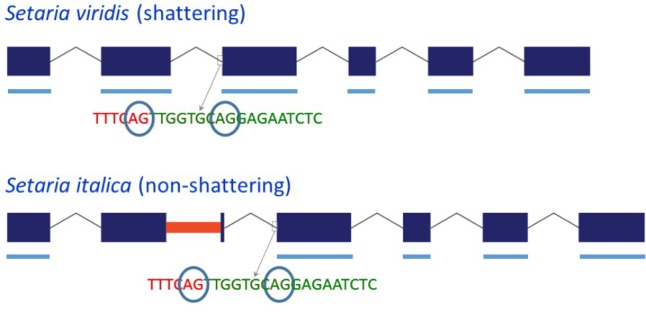
FIGURE 2.

Schematic representation of the structure of the Sh1 gene and its transcript in S. viridis and S. italica. Blue boxes represent exons and thin lines represent introns. The red bar in exon 2 represents the MITE insertion. Thick blue lines underneath the exons represent exonic sequence present in the transcript. The circled “AG” indicates alternative splice sites.
