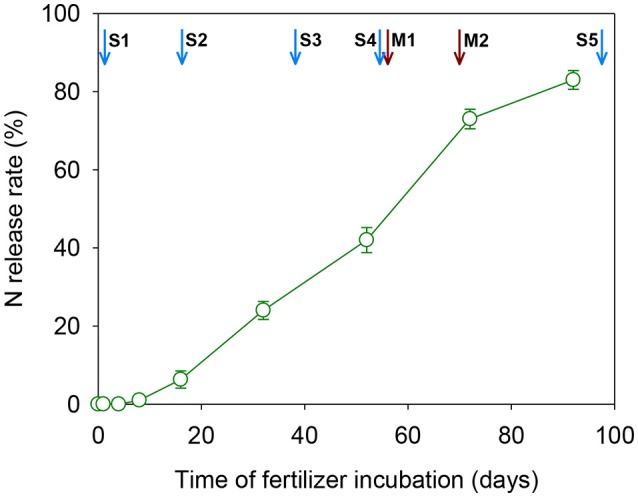
Figure 2.

Nitrogen release curve of the CRU under the container experimental condition. Arrows in blue indicate the key rice growth stages: S1, transplanting; S2, tillering; S3, panicle initialing; S4, flowering; S5, maturity. Arrows in red indicate times of physiological measurements: M1, 3DAA; M2, 17DAA.
