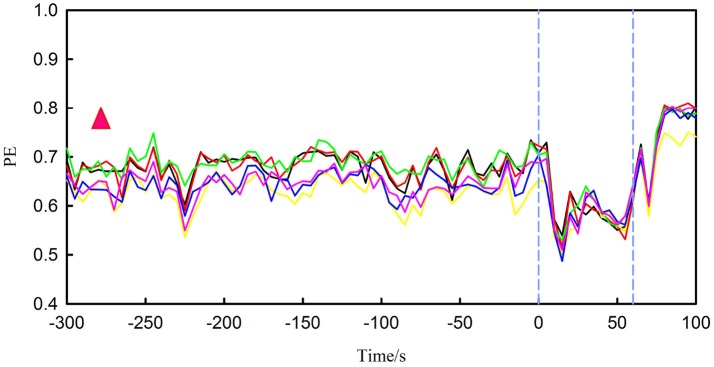
Figure 4.
It represents PE for the first seizure of patient 17, in which the interval between the two blue vertical lines is ictal period. There are six different lines, each colored broken line represents changes in PE for one channel. The red triangle represents the range of PE during the interictal period.

