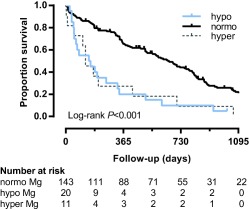
Figure 3.

Kaplan‐Meier curve illustrating survival in cats with azotemic CKD grouped by magnesium status. Cats with hypomagnesemia (blue curve; 1/20 censored; HR, 2.92; 95% CI, 1.78‐4.82; P < .001) and hypermagnesemia (gray curve; 0/11 censored; HR, 2.88; 95% CI, 1.54‐5.38; P = .001) at diagnosis of azotemic CKD were at increased risk of death compared with normomagnesemic cats (black curve; 23/143 censored). No significant difference in survival was observed between hypomagnesemic and hypermagnesemic cats in univariable analysis (P = .95). Hypomagnesemia remained an independent predictor of mortality in multivariable analysis (HR, 2.74; 95% CI, 1.35‐5.55; P = .005), but the association between hypermagnesemia and mortality lost significance (HR, 1.66; 95% CI, 0.74‐3.70; P = .22). Censored cases are ticked
