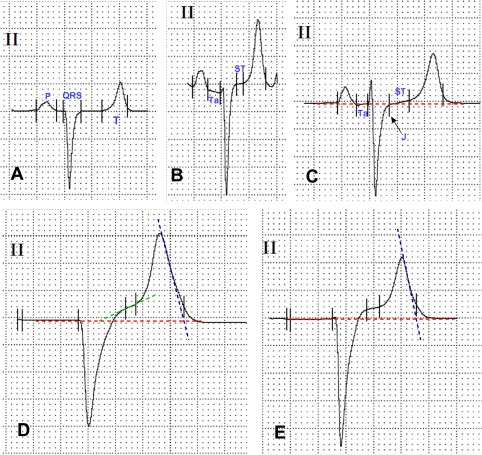
Figure 2.

Representative graphical display of software‐based ECG analysis, which required placement of markers for the start and end points of the P, QRS, and T waves (paper speed 50 mm/s, sensitivity 10 mm/mV). A, ECG with horizontal ST segment. B, ECG with a prominent Ta wave and an almost horizontal ST segment but increased ST segment amplitude. C, ECG showing a Ta wave and J point depression (arrow) with ascending ST segment. D, E, ECGs showing missing P waves and increased ST segment amplitudes. Note the endpoints for T wave, which were defined as the points where the tangent of the steepest downslope of the T wave (dashed blue line) intersects with the isoelectric line (dashed red lines). ST‐angle was defined as the angle formed by the baseline and the tangent of the ST segment (dashed green line)
