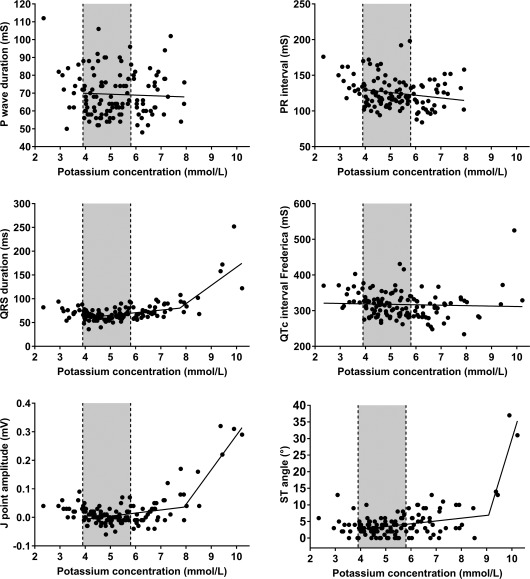
Figure 7.

Scatterplots illustrating the association between plasma potassium concentration and P wave duration, PR interval, QRS duration, corrected QT interval according to Fridericia, J point amplitude, and ST angle. The lines represent the result of simple linear regression (P wave duration, PR interval, QTc interval) and segmented regression analysis (QRS duration, J point amplitude, ST angle). Gray‐shaded areas represent the reference range for plasma potassium concentration (3.9‐5.8 mmol/L)
