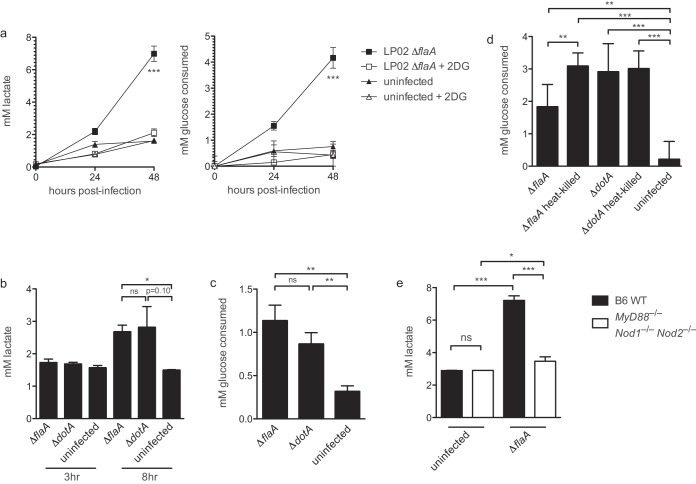
FIG 1.
Increased glycolysis in BMMs during L. pneumophila infection. (a) Lactate levels and glucose consumption over 48 h in culture supernatant from uninfected BMMs (derived from wild-type C57BL/6 mice unless otherwise indicated) and BMMs infected with LP02 ΔflaA with or without 1.0 mM 2DG added 1 h postinfection (MOI = 0.05). (b) Lactate levels in culture supernatant from uninfected BMMs and BMMs infected with LP01 ΔflaA or LP01 ΔdotA L. pneumophila (MOI = 2.0). (c) Glucose consumption by uninfected BMMs or BMMs infected with LP01 ΔflaA or LP01 ΔdotA L. pneumophila (MOI = 2.0) at 8 h postinfection. Levels were calculated by measuring the change in glucose concentration at 8 h relative to 0-h controls. (d) Glucose consumed at 24 h postinfection by uninfected BMMs or BMMs infected with live and heat-killed LP02 ΔflaA and LP02 ΔdotA L. pneumophila (MOI = 1.0). The levels were calculated by measuring the change in glucose concentration at 24 h relative to 0-h controls. (e) Lactate levels in culture supernatant from uninfected wild-type BMMs and MyD88−/− Nod1−/− Nod2−/− BMMs and infected BMMs of both genotypes at 48 h postinfection with LP02 ΔflaA L. pneumophila (MOI = 0.05). Data are representative of at least three independent experiments. In panel a, symbols and error bars represent means ± the standard deviations from three technical replicates. Curves in panel a depicting BMMs infected with LP02 ΔflaA are significantly distinct from other curves in each graph (P < 0.001, two-way analysis of variance [ANOVA]). For histograms, bars and error bars represent means ± the standard deviations from at least three technical replicates. *, P < 0.05; **, P < 0.01; ***, P < 0.001; ns, not significant (two-tailed Student t test).

