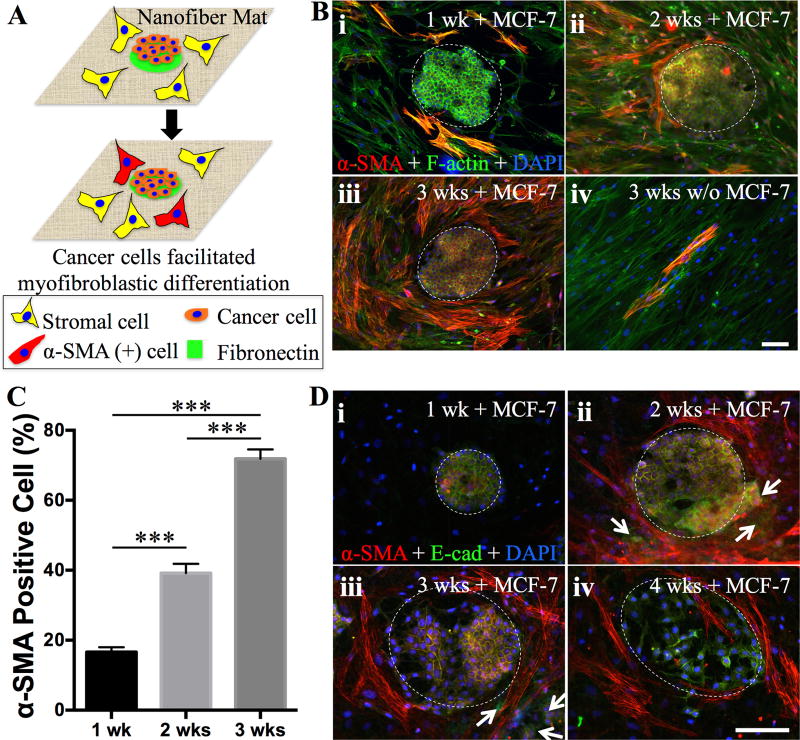
Figure 4.
A) Schematic illustration on the experimental design for studying cancer-stromal cell interaction. 200-µm dots of FNs are printed onto the nanofiber matrices for selective attachment of cancer cells (MCF-7) to form cancer clusters and the remaining area is seeded with human adipose stromal cells (ASCs). Cancer cells would recruit the stromal cells by differentiating them into α-SMA positive cells. B) Co-culture of MCF-7 cells and ASCs (high seeding density) on the PCL nanofiber matrices with printed 200-µm FN dots, onto which MCF-7 cells primarily attached and formed the colony as indicated by dashed white circles. Fluorescence images of the cells immunostainned for α-SMA (red), F-actin (green) and DAPI (blue) after culturing for 1 week (i), 2 weeks (ii), 3 weeks (iii). The culture of ASCs without MCF-7 was included as controls (iv). C) Quantitative analysis of α-SMA positive cells normalized by the total stromal cell number in each image (n≥5, ***p<0.001). Co-culture of MCF-7 cells and ASCs (low seeding density) on the PCL nanofiber matrices with printed 100-µm FN dots, onto which MCF-7 cells primarily attached and formed the colony as indicated by dashed white circles. Fluorescence images of the cells immunostainned for α-SMA (red), E-Cadherin (green) and DAPI (blue) after culturing for 1 week (i), 2 weeks (ii), 3 weeks (iii) and 4 weeks (iv). White arrows indicate those cancer cells migrated out of the cell colony. Scale bars: 100 µm.

