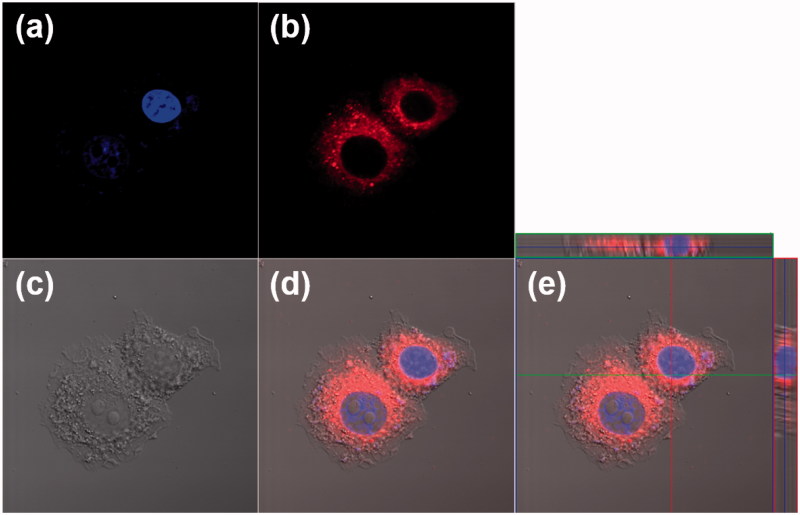
Figure 4.
Cellular uptake of HSA-PEG/DiIC18 in SK-BR-3cells. The images were obtained by a confocal laser scanning microscope 4 h after the treatment of HSA-PEG/DiIC18. (a) DAPI (blue), (b) DiIC18 (red), (c) differential interference contrast (DIC) image, (d) merged image, and (e) merged image with orthogonal z-stack projection.

