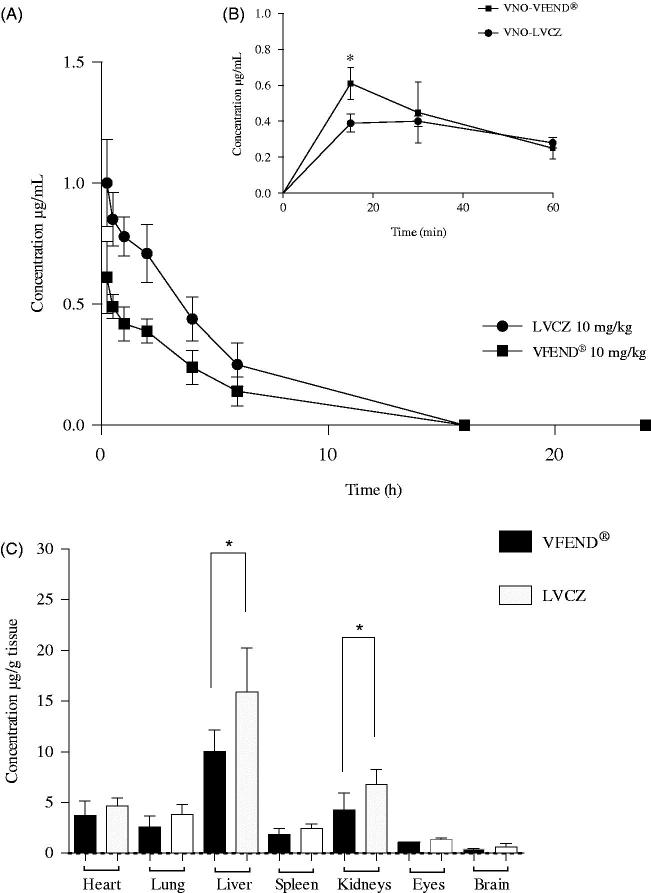
Figure 3.
Pharmacokinetic and biodistribution profile of voriconazole from two different formulations. (A) Blood levels of intravenously injected voriconazole versus time 0–24 h (AUC0–24) delivered from liposomal formulation (circles) and VFEND® (squares) at 10 mg/kg. (B) Concentrations versus time of the metabolite (voriconazole-N-oxide) measured within the hour following intravenous administration of the formulations. Data are expressed as mean ± SD (n = 12 animals per group). (C) Tissue distribution of voriconazole 4 h after I.V. administration of liposomal formulation (white bars) and voriconazole complexed in sulfobutyl ether-beta-cyclodextrin so + dium, commercially available as VFEND® (black bars). Bars represent the standard deviation (n = 6). (*indicates p<.05).

