Figure 1.

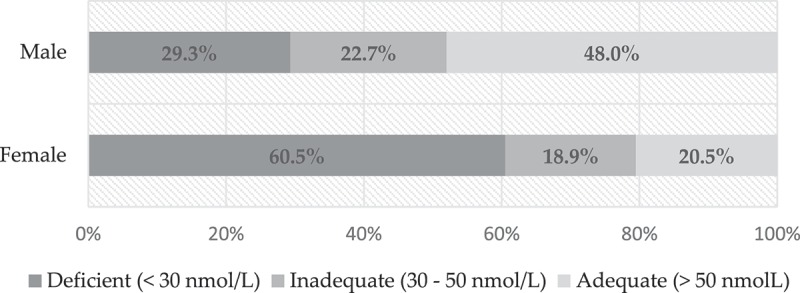
Distribution of participants according to the 25(OH)D cut-off levels by gender (chi-square test was used for comparison between gender and vitamin D status categories).

Distribution of participants according to the 25(OH)D cut-off levels by gender (chi-square test was used for comparison between gender and vitamin D status categories).