
Figure 2.
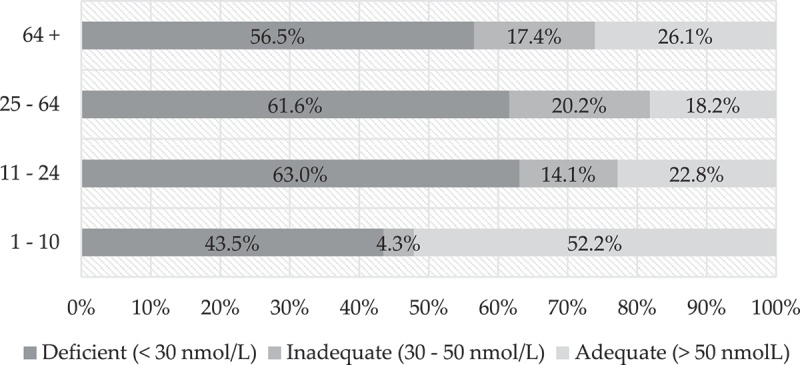
Percentage distribution of female participants according to 25(OH)D level and age groups (chi-square test was used for comparison between age groups and vitamin D status categories).
Official websites use .gov
A
.gov website belongs to an official
government organization in the United States.
Secure .gov websites use HTTPS
A lock (
) or https:// means you've safely
connected to the .gov website. Share sensitive
information only on official, secure websites.
Percentage distribution of female participants according to 25(OH)D level and age groups (chi-square test was used for comparison between age groups and vitamin D status categories).