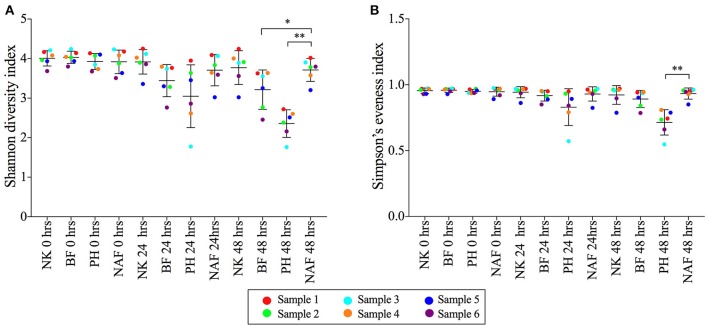
Figure 2.
The (A) Shannon diversity indices and (B) Simpson's evenness indices of microbial communities from each treatment at 0, 24, and 48 h. Data is shown as mean ± SD for samples with NutriKane (NK), Benefiber (BF), Psyllium husk (PH) and no added fiber control (NAF) at 0, 24, and 48 h. Biological samples (sample 1–6) are indicted by color-coded dots as shown in the key. Significance was determined using Kruskal-Wallis test with Dunn's multiple comparisons (*P < 0.05, **P < 0.01).

