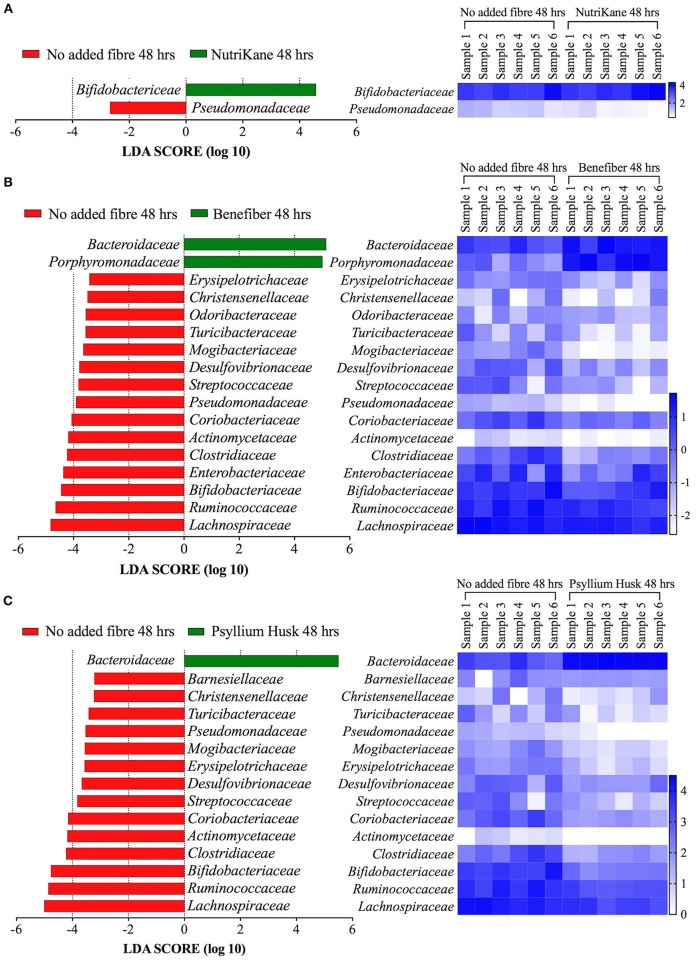
Figure 3.
Key gut microbiota bacterial families that respond to fiber supplementation at 48 h. Data was obtained using LEfSe analyses between (A) NutriKane vs. no added fiber control, (B) Benefiber vs. no added fiber control and (C) Psyllium husk vs. no added fiber control. The left histogram shows the LDA scores computed for each bacterial family and the right heat map shows the relative abundance (Log10 transformation) of the families in each of the six biological samples. In the heat map, rows correspond to bacterial families and columns correspond to an individual (Sample 1–6). Blue and white denote the highest and lowest relative abundance, respectively, as shown in the key.

