
Figure 1.
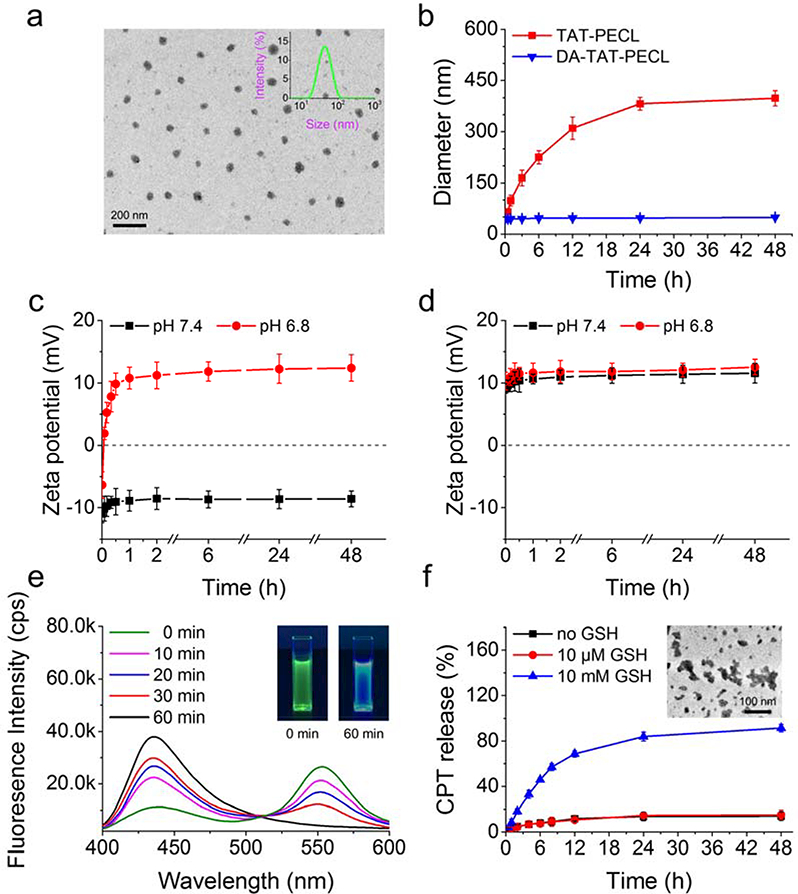
a) Size distribution detected by DLS and TEM image of DA-TAT-PECL micelles. b) Size change in TAT-PECL and DA-TAT-PECL micelles after incubation with 0.5 mg ML−1 bovine serum albumin (BSA). Zeta-potential change in DA-TAT-PECL c) and TAT-PECL d) micelles at pH 7.4 and pH 6.8. e) Fluorescence spectra of (CPT)2-ss-Mal in the presence of 10 mM GSH at different time points. Excitation wavelength was set at 370 nm. Inset: pictures of (CPT)2-ss-Mal in the presence of 10 mM GSH under UV irradiation (365 nm) for 0 min (left) and 60 min (right). f) Percent CPT released from the (CPT)2-ss-Mal-loaded DA-TAT-PECL micelles in the absence or presence of 10 μΜ and 10 Mm GSH. Inset: TEM image of the (CPT)2-ss-Mal-loaded DA-TAT-PECL micelles after treatment of 10 mM GSH for 48 h.