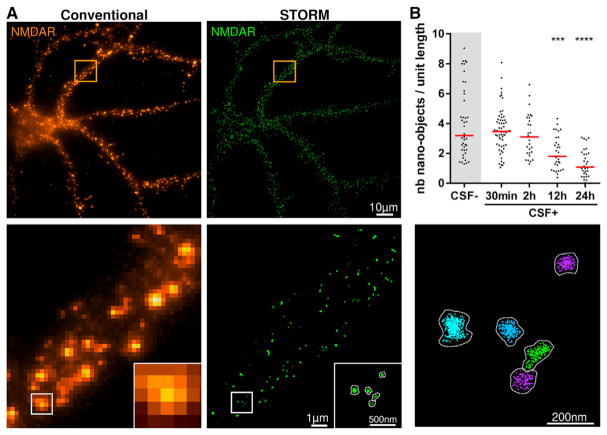
Figure 1. NMDAR Autoantibodies Lead to a Decrease in the Surface Density of NMDAR Nano-objects as Revealed by Super-resolution Microscopy.
(A) A representative conventional wide-field (upper left panel) and super-resolution (upper right panel) fluorescence image of NMDAR in cultured hippocampal neurons. Zoom of the region inside the orange square in the conventional image is shown in the lower left panel. A super-resolution image of the region inside the white square is shown in the lower middle panel. The lower right panel displays the result of the cluster analysis, in which each NMDAR nano-object in the super-resolution image is segmented as a different color using the raw localization data. The number of localizations (given by the individual crosses), the area of the nano-objects, and the number of localizations per nano-object can be quantified after cluster analysis.
(B) Neurons were treated for 30 min or 2, 6, 12, or 24 hr with control or patients’ CSF (CSF− and CSF+, respectively), and the density of surface NMDAR nano-objects per unit length (in micrometers) of dendrite was measured in the super-resolution images. When compared to control CSF (CSF−), the incubation with patients’ CSF (CSF+) caused a significant reduction of the surface NMDAR nano-objects, with a maximal reduction at 24 hr of treatment. Bars represent medians, and dots correspond to individual cells (n ≥ 29 fields of view; ***p < 0.001, ****p < 0.0001).
See also Figures S1 and S2.

