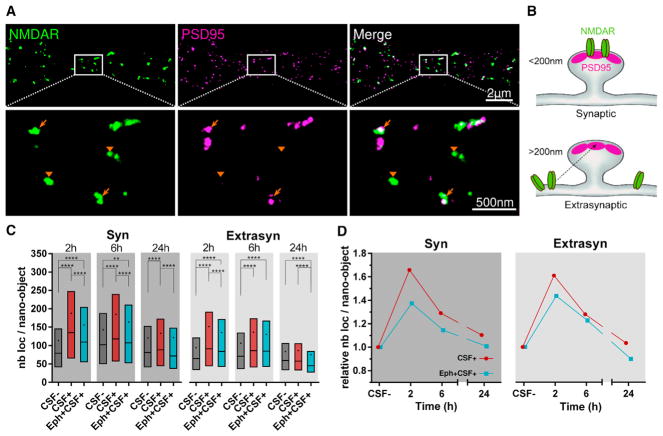
Figure 2. NMDAR Autoantibodies Induce a Time-Dependent Increase in the Receptor Content of the Surface NMDAR Nano-objects.
(A) Upper panels show a representative STORM image of the surface NMDAR (green) and PSD95 (magenta). Lower panels are higher magnifications of the white region, showing examples of synaptic (arrows) and extrasynaptic (arrowheads) NMDAR nano-objects.
(B) Schematic illustration representing the distinction used to identify synaptic versus extrasynaptic NMDAR nano-objects located within 200 nm of the center of the closest PSD95 nano-object versus farther away.
(C) Quantification of the number of localizations per NMDAR nano-object, a relative measure of the receptor content of the nano-objects, after 2, 6, or 24 hr of incubation with the control CSF (CSF−, dark gray), with patients’ CSF alone (CSF+, red), or in the presence of ephrin-B2 (Eph+CSF+, cyan). The box, line, and dot correspond to interquartile range (IQR, 25th–75th percentile), median, and mean, respectively (synaptic, n ≥ 835 nano-objects; extrasynaptic, n ≥ 2001 nano-objects; **p < 0.01, ***p < 0.001, ****p < 0.0001).
(D) Relative change in the number of localizations per nano-object obtained by normalizing the CSF+ means at each time to the corresponding CSF− means.
(See also Figure S3.

