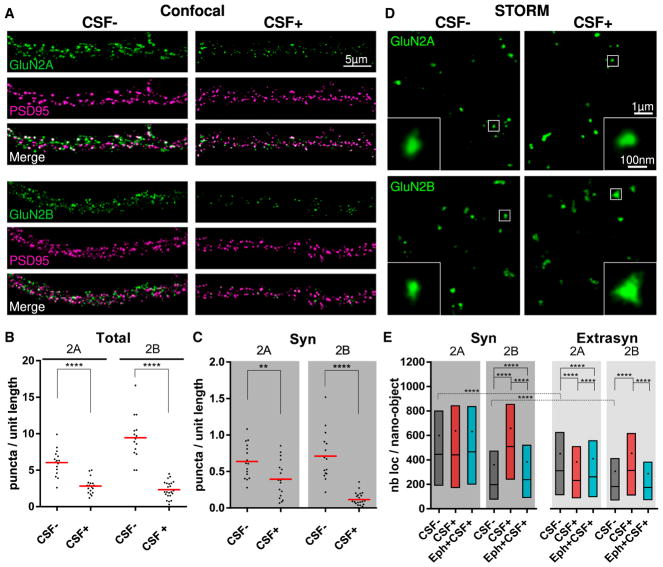
Figure 3. NMDAR Autoantibodies Alter Differently the Distribution of GluN2A-NMDAR and GluN2B-NMDAR.
(A) Representative confocal images of surface GluN2A-NMDAR (green, upper panels) or GluN2B-NMDAR (green, lower panels) subunits labeled, together with PSD95 (magenta), after 24 hr of incubation of control or patients’ CSF (CSF−, left panels, and CSF+, right panels). Note the visible decrease in the GluN2A and GluN2B labeling in the presence of the patients’ CSF.
(B and C) Quantification of the density of surface GluN2A or GluN2B puncta per unit length (in micrometers) of dendrite either considering all surface puncta (B, Total) or isolating the ones that co-localize with PSD95, and are synaptic (C, Syn). Red lines represent the means, and dots correspond to individual cells (n ≥ 15 fields of view; **p < 0.01, ***p < 0.001, ****p < 0.0001).
(D) Representative STORM images of GluN2A (upper) and GluN2B (lower) that have been incubated with control or patients’ CSF (CSF−, left panels, and CSF+, right panels, respectively) for 24 hr. Insets show zooms of nano-objects corresponding to the white squared region. Note the increased size of the GluN2B nano-objects in the CSF+ condition.
(E) Quantification of the number of localizations per NMDAR nano-object after 24 hr of incubation with control CSF (CSF−, dark gray), with patients’ CSF alone (CSF+, red), or in the presence of ephrin-B2 (Eph+CSF+, cyan). The box, line, and dot correspond to IQR, median, and mean, respectively (synaptic, n ≥ 2,649 nano-objects; extrasynaptic, n ≥ 5,213 nano-objects; ****p < 0.0001).
See also Figures S4 and S5.

