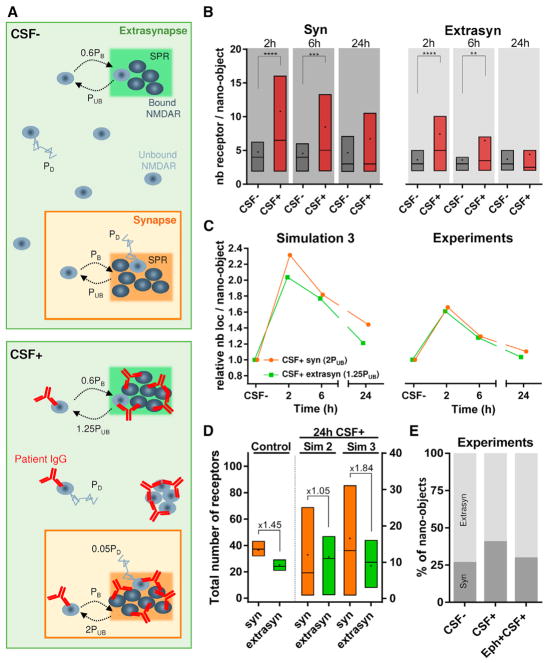
Figure 4. Monte Carlo Simulations Recapitulate Experimental Results.
(A) Schematic representation (top view) of NMDAR dynamics simulation for CSF− (control or without antibodies) and CSF+ (with NMDAR antibodies). The synapse and extrasynapse are represented as orange and green areas, respectively (not represented here at their true scale value), with one scaffold protein region (SPR) in each. The receptors follow binding and unbinding events with the scaffold proteins in the SPR and can be in a bound state (dark gray) or an unbound state (light gray). The binding probability of a receptor is PB = 1 in the synapse and 0.6PB in the extra-synapse for both CSF− and CSF+. The unbinding probability of a receptor is PUB = 0.167 in both the extrasynapse and the synapse for CSF−. For CSF+, unbinding probability increases to 1.25PUB in the extrasynapse and 2PUB in the synapse. All unbound receptors diffuse with a probability PD = 1 for CSF−. For CSF+, unbound receptors belonging to a nano-object diffuse with a reduced probability of 0.05PD, but this diffusion probability remains unchanged for unbound receptors not forming any nano-object.
(B) Distribution of receptors per nano-object at 2, 6, and 24 hr in the synapse and extrasynapse for both CSF− and CSF+ conditions obtained from simulation. The box, line, and dot correspond to IQR, median, and mean, respectively (synaptic, n ≥ 56 nano-objects; extrasynaptic, n ≥ 60 nano-objects; **p < 0.01, ***p < 0.001, ****p < 0.0001). (C) Comparison of the fold change in nano-object content at different times (2, 6, and 24 hr) relative to the corresponding CSF− values for simulations (left) and experimental data (right). Each data point is obtained by normalizing the mean of receptors per nano-object value at each time point for CSF+ with the mean of receptors per nano-object value obtained from the corresponding time points for CSF−.
(D) Total number of receptors present in the synapse (orange) and extrasynapse (green) at 24 hr for simulation control (left), simulation 2 (middle), and simulation 3 (right). Data are obtained from the simulated area of ~200 × 200 nm2 for both synapse and extrasynapse. The fold difference from the mean of the synaptic to the extrasynaptic number of receptors is indicated above the boxes. The box, line, and dot correspond to IQR, median, and mean, respectively (control, n = 40 runs; simulation 2, n = 19 runs; simulation 3, n = 22 runs).
(E) Quantification of percentage of synaptic (dark gray) versus extrasynaptic (light gray) nano-objects from experimental data after 24 hr of treatment with patients’ CSF alone (CSF+) or in the presence of ephrin-B2 (Eph+CSF+).

