FIGURE 2.

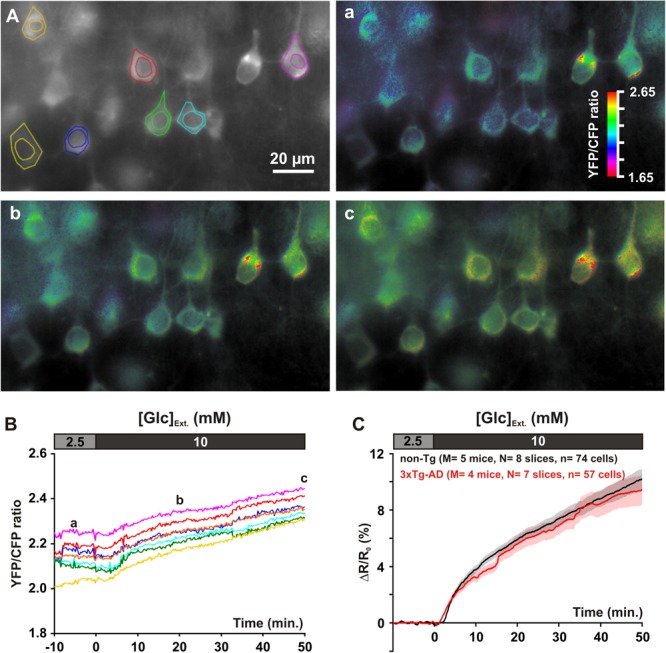
Glucose uptake in layer II and III pyramidal cells. (A) The gray scale image shows the YFP fluorescence. Pseudocolor images show the YFP/CFP ratio value [coded by pixel hue, see scale bar in (a)] and the fluorescence intensity (coded by pixel intensity) at different time points before (a) and after (b,c) superfusion of 10 mM glucose. (B) Traces show average YFP/CFP ratio measure at the cytosolic part of the soma of individual pyramidal cells delineated in (A). (a–c) indicate time points corresponding to the pseudocolor images shown in (A). (C) Mean relative YFP/CFP ratio changes in pyramidal cells of non-Tg (black trace) and 3xTg-AD mice (red trace) induced by superfusion of 10 mM glucose. Traces show mean (solid lines) ± standard errors of the mean (color shades). Note the slowly developing increase in mean relative ratio during 10 mM glucose superfusion and the similar temporal profiles between non-Tg and 3xTg-AD mice.
