
FIGURE 3.
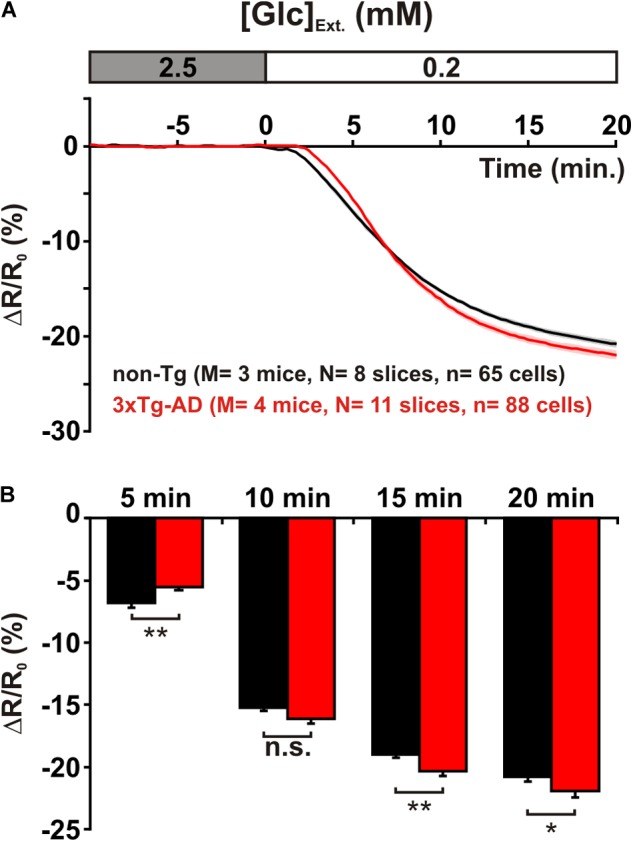
Metabolic activity of layer II and III pyramidal cells. (A) Mean relative YFP/CFP ratio changes in pyramidal cells of non-Tg (black trace) and 3xTg-AD mice (red trace) induced by glucose (Glc) restriction (0.2 mM). Traces show mean (solid lines) ± standard errors of the mean (color shades). Note the slowly developing decrease in mean relative ratio during 0.2 mM Glucose superfusion. Note also the difference in the temporal profiles between non-Tg and 3xTg-AD mice. (B) Histograms show the metabolic activity (decrease in relative YFP/CFP ratio) at different time of glucose restriction. After 5 min of glucose restriction pyramidal cells of non-Tg mice exhibit a higher metabolic activity than those of 3xTg-AD mice. In contrast, during longer glucose restriction pyramidal cells of 3xTg-AD mice display a higher metabolic activity. n.s. not statistically significant.