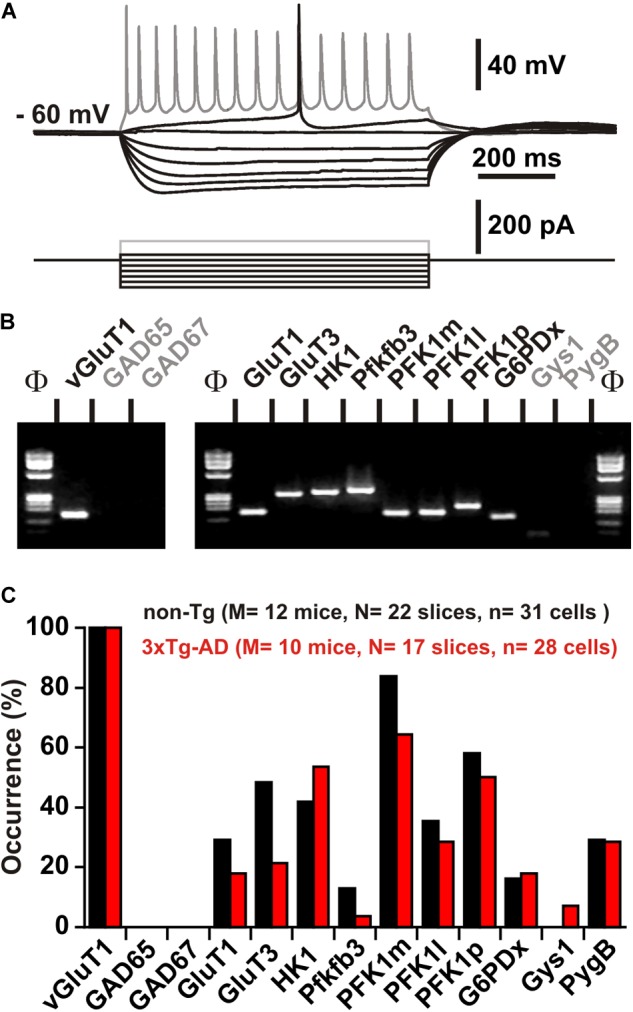
FIGURE 6.

Characterization of key molecular elements of glucose metabolism in layer II and III pyramidal cells. (A) Voltage responses (upper traces) induced by injection of current pulses (bottom traces) in a non-Tg layer II and III pyramidal cell. In response to just-above-threshold current pulse, this neuron fired an action potential with a long lasting biphasic AHP (middle trace). Near saturation it showed the typical firing of a regular spiking neuron with marked frequency adaptation and spike amplitude accommodation (shaded trace). (B) The pyramidal cell shown in (A) expressed vGluT1, GluT1, GluT3, HK1, pfkfb3, PFK1m, PFK1l, PFK1p, and G6PDx. (C) Histograms showing the expression profiles of key molecular elements of glucose metabolism in layer II and III pyramidal cells of non-Tg (black) and 3xTg-AD mice (red). No statistically significant difference in the occurrence of genes was observed. Note the very low occurrence of pfkfb3 and Gys1 (glycogen synthase) in pyramidal neurons.
