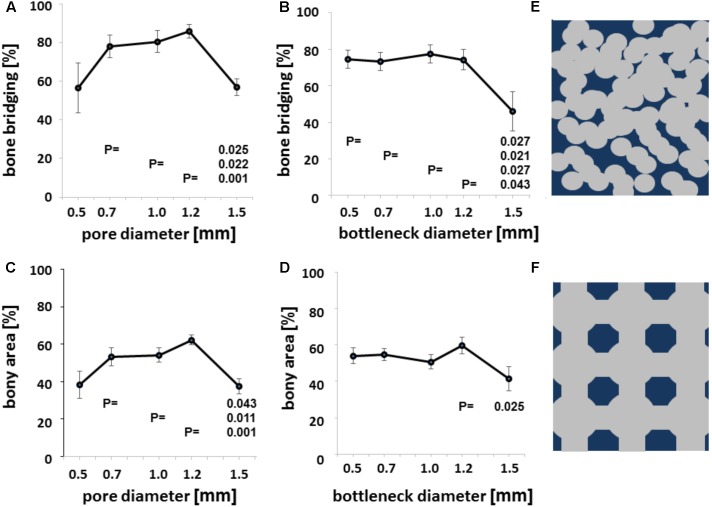
FIGURE 4.
Microarchitecture and osteoconduction. Bony bridging in relation to pore diameter of all groups (A). Bony bridging and bottleneck diameter. Bony bridging in relation to bottleneck diameter of all groups (B). Bony regenerated area and pore diameter. Bony regenerated area in relation to bottleneck diameter of all groups (C). Bony regenerated area and bottleneck diameter. Bony regenerated area in relation to bottleneck diameter of all groups (D). All graphs display the means and the standard error of the means. P-values are displayed. Schematic drawing of conventional scaffold based on random distributed 0.5 mm diameter pores. Scaffold in dark blue and pores in gray (E). Schematic drawing of additively manufactured scaffold based on 1.2 mm pores and bottlenecks of 0.7 mm Scaffold in dark blue and pores in gray (F).

