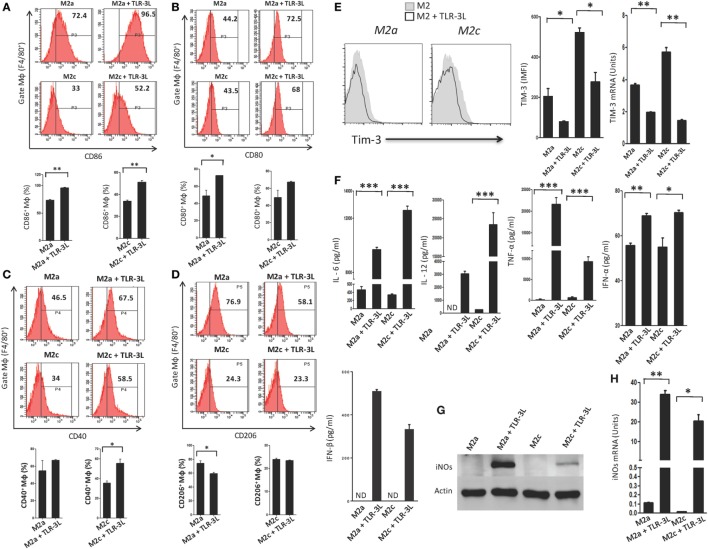
Figure 2.
TLR-3 triggering reverts M2a and M2c macrophages to M1 phenotype. Macrophages were cultured in M2a and M2c differentiating conditions followed by treatment with TLR-3L for 24 h. The F4/80+ gated cells were assessed for the expression of (A) CD86; (B) CD80; (C) CD40; (D) CD206. Number in the inset of flow cytometry histogram indicates the percent of positive cells and expressed as bar diagram (lower panel). (E) The expression of Tim-3 was monitored by flow cytometry. The results are confirmed by quantitative RT-PCR (RT-qPCR) and the data depicted as bar diagram (side panel). (F) The IL-6, IL-12, TNF-α, IFN-α, and IFN-β were quantified in the culture SNs by ELISA. (G) The iNOs was detected in the whole cells lysate by western blotting and further confirmed by (H) RT-qPCR (side panel). The data expressed as mean ± SD are representative of two to three independent experiments (*p < 0.05; **p < 0.01; ***p < 0.001).

