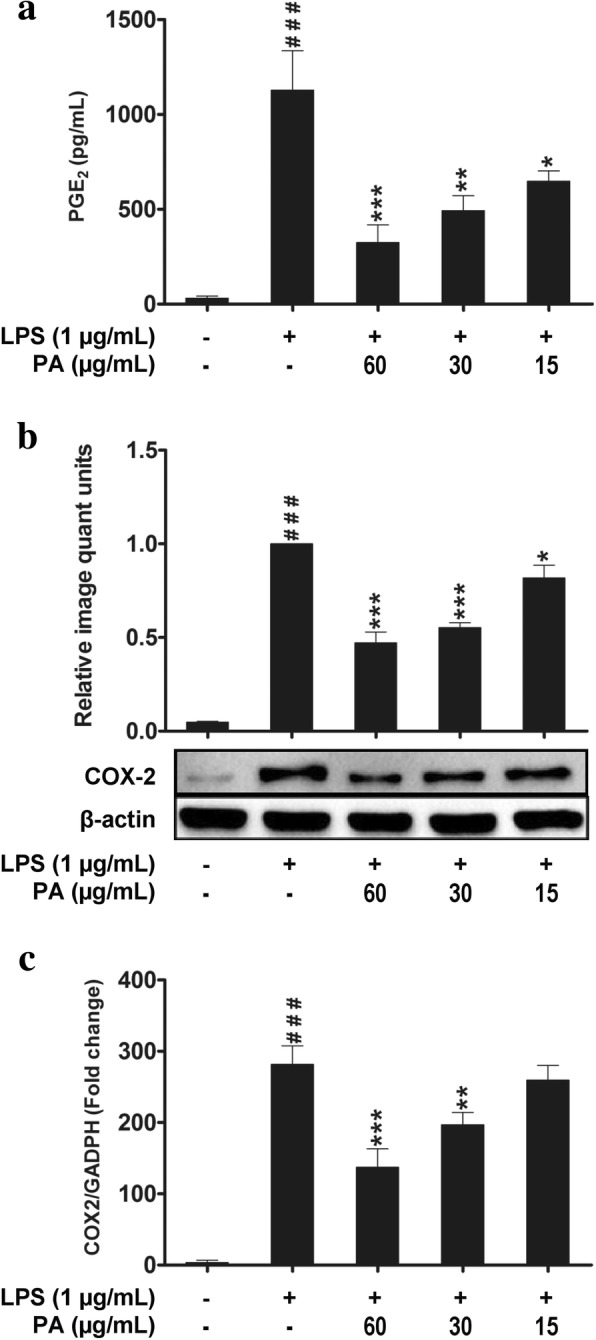
Fig. 3.

Effects of Phyllanthus amarus on the release of PGE2 production (a). Effects of P. amarus on COX-2 protein expression (b) and mRNA expression (c). Data are presented as mean ± SEM with (n = 3). ###P < 0.001 represents the significant difference from the control. *P < 0.05, **P < 0.01, and ***P < 0.001 represent significance to the LPS alone versus PA
