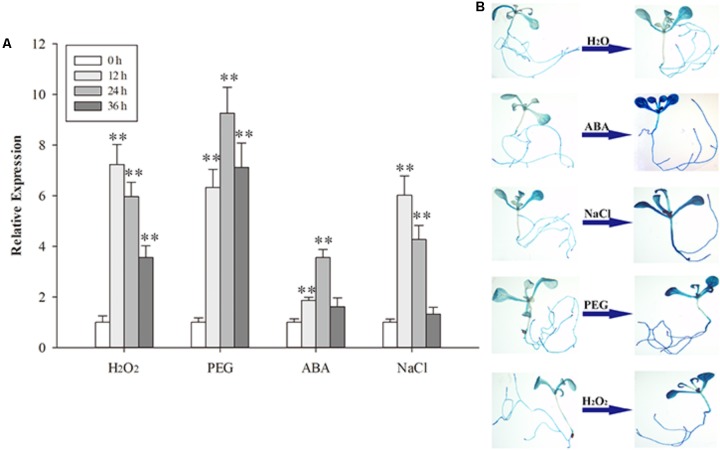
FIGURE 5.
The expression of AtPDI1 under different stresses (A) and the AtPDI1 promoter-glucuronidase (GUS) expression pattern in transgenic Arabidopsis plants under various stresses (B). For (A), results are represented as mean values of three independent replicates and error bars indicate standard deviation. The statistical significance level is shown using asterisks (Student’s t-test; ∗P < 0.05; ∗∗P < 0.01).

