Fig. 3.

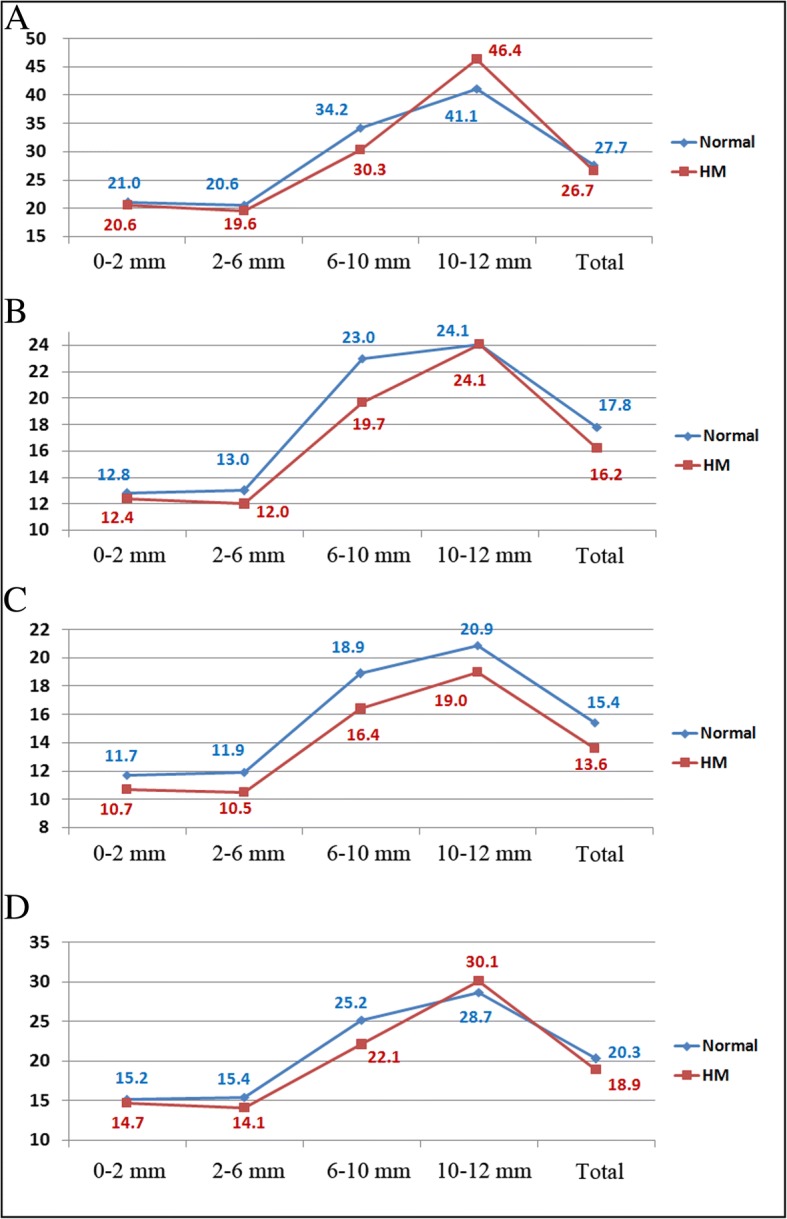
Mean densitometry values of the anterior layer (panel a), center layer (panel b), posterior layer (panel c), and total corneal thickness (panel d) in the normal and HM groups. HM = high myopia; Total = total 0–12 mm diameter

Mean densitometry values of the anterior layer (panel a), center layer (panel b), posterior layer (panel c), and total corneal thickness (panel d) in the normal and HM groups. HM = high myopia; Total = total 0–12 mm diameter