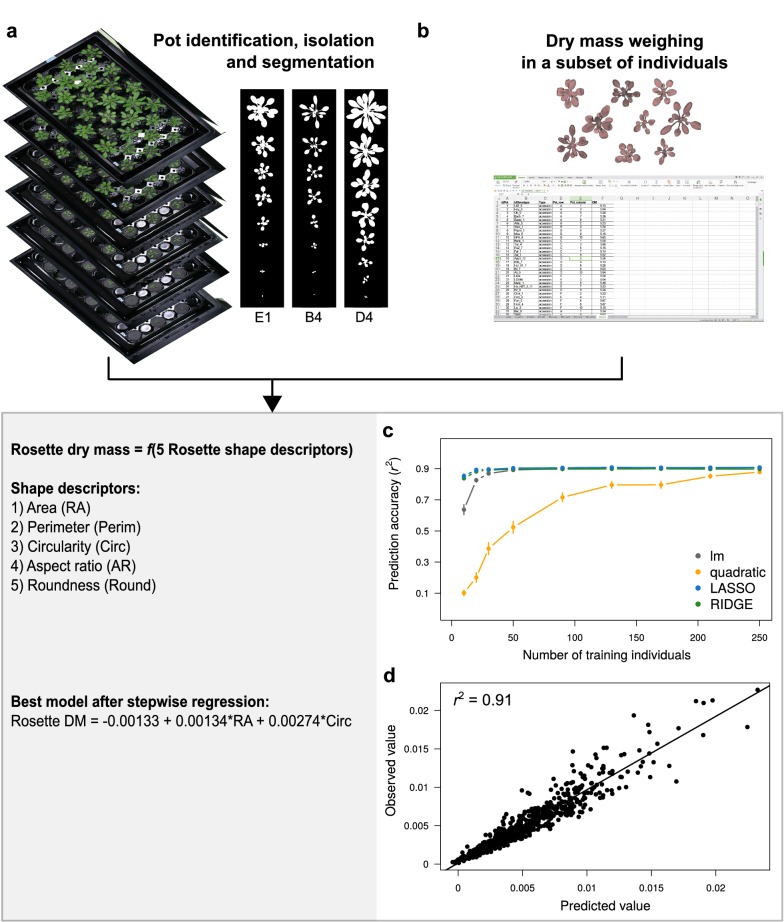
Fig. 1.
Estimation of plant dry mass from image analysis and statistical modeling. a Example of sequential tray images, analyzed with ImageJ to extract individual rosette shape descriptors during ontogeny. b Dry rosettes weighed at 16 DAG in the training population. c Series of cross-validation performed for different predictive models with different training population size (x axis). Dots represent mean prediction accuracy, measured as Pearson’s coefficient of correlation (r2) between observed and predicted values. Error bars represent 95% confidence interval (CI) across 100 random permutations of the training dataset. d Correlation between observed and predicted values from the best model obtained after stepwise regression, performed 60 individuals to train the model, and tested on 300 individuals not used to train the model

