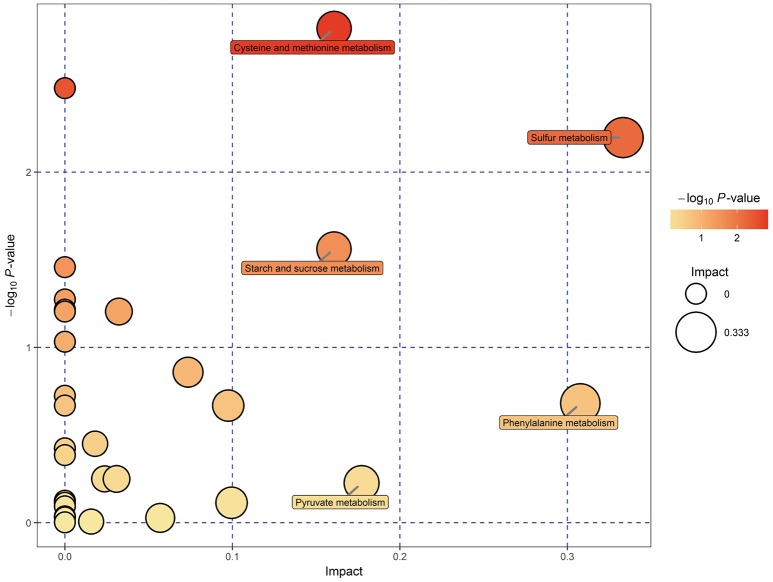
Figure 5.
Metabolomic view map of significant metabolic pathways characterized in the hepatopancreas of P. f. martensii in EG and CG. This figure illustrates significantly changed pathways based on enrichment and topology analysis. The x-axis represents pathway enrichment, and the y-axis represents pathway impact. Large sizes and dark colors represent great pathway enrichment and high pathway impact values, respectively.

