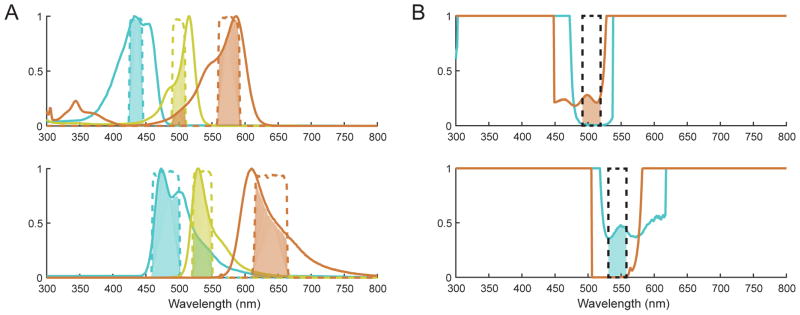
Figure 2.
A. Absorption (upper) and emission (lower) spectra of an example fluorescent protein combination suitable for multiplexed imaging, comprising a CFP (mTurquoise2, in cyan), a YFP (mVenus, in yellow) and a RFP (mCherry, in orange). Appropriate filters are indicated by dashed lines, color-coded according the protein they are intended to measure. The relative contribution of each protein through each filter is shown as the shaded area beneath the filter band. The contributions of RFP to YFP excitation and CFP to YFP emission are allowable because neither contributes significantly to both filters. B. Example filter selection for YFP, by plotting the interference ratio of the other fluorophores (RFP in orange, CFP in cyan). The ratio is defined as the interfering spectrum divided by the intended spectrum, bounded on 0 to 1 for convenient visualization. Suitable filter regions are shown by dashed black lines, with shaded regions indicating the interference contribution. Filters should be placed where the ratio is minimal, and contribution of any interfering fluorophore through both filters should be strictly avoided.

