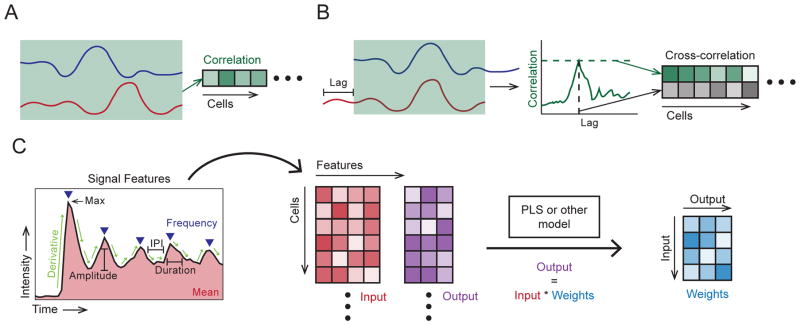
Figure 3.
Examples of paired signal analyses. A. Correlation, computed for each cell, yielding a vector of coefficients. B. Cross-correlation, computed from the correlation of shifted (lagged) traces. For each cell, the peak correlation and corresponding lag are stored, yielding a vector for each. C. Signal response modeling example, using a feature decomposition (left) extracting the: mean value, max value, frequency, amplitudes, derivatives, pulse durations and inter-pulse intervals (IPI). Mean and/or maximum values of the latter four features would be stored (center). Stored features are used to fit model weights (right, e.g. via PLS), so that output values may be estimated by these weights and the input values.

