. 2015 Nov 5;5(1):248–258. doi: 10.1039/c5tx00211g

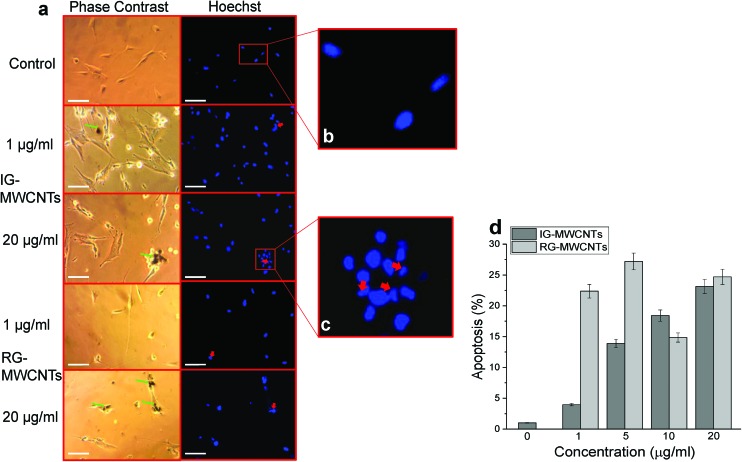
Fig. 4. Apoptosis responses in MRC-5 cells following MWCNTs exposure for 24 h using Hoechst and Annexin V assay. (a) Phase contrast (left panel) images show IG-MWCNTs or RG-MWCNTs (green arrow) and corresponding fluorescent images (right panel) show apoptotic nuclei (red arrow). Scale bar: 5 μm. (b) An enlarged fluorescent image of the selected area from the control showing normal phenotype of MRC-5 nuclei. (c) An enlarged fluorescent image of the selected area from 20 μg ml–1 of IG-MWCNTs showing apoptotic phenotype of MRC-5 nuclei. (d) Percentage of apoptosis following exposure to varying concentrations of MWCNTs with respect to MRC-5 cells non-exposed to MWCNTs (0 μg ml–1). Error bars are standard error of the mean. *p < 0.001 vs. 0 μg ml–1 for both IG-MWCNTs and RG-MWCNTs.

Fig. 4