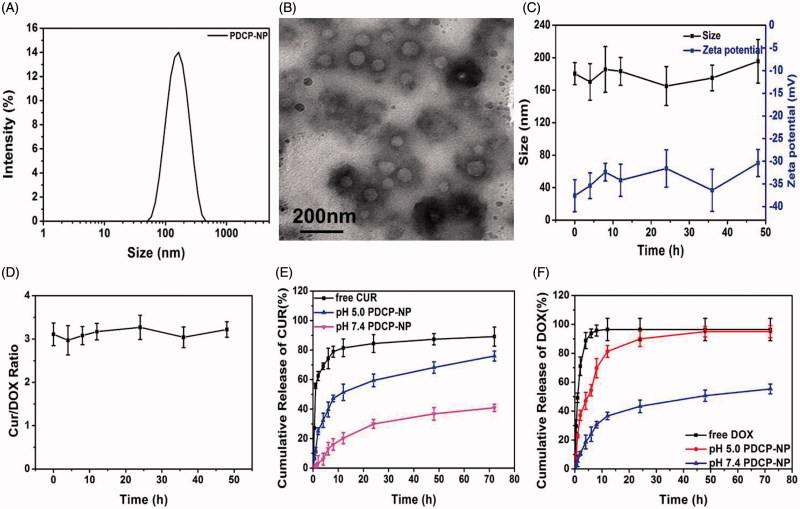
Figure 2.
(A) DLS and (B) TEM graphics of PDCP-NP in pH7.4 PBS of PDCP-NP, (C) the size/Zeta potential of PDCP and (D) the dose ratio of Cur/DOX in PDCP at different time interval during incubating with physiology-mimicking medium containing 10% FBS at 37 °C, and the cumulative release profiles of Cur (E) and DOX (F) from PDCP in pH7.4 PBS or pH 5.0 acetate buffer. Results are expressed as the mean ± SEM (n = 3).

