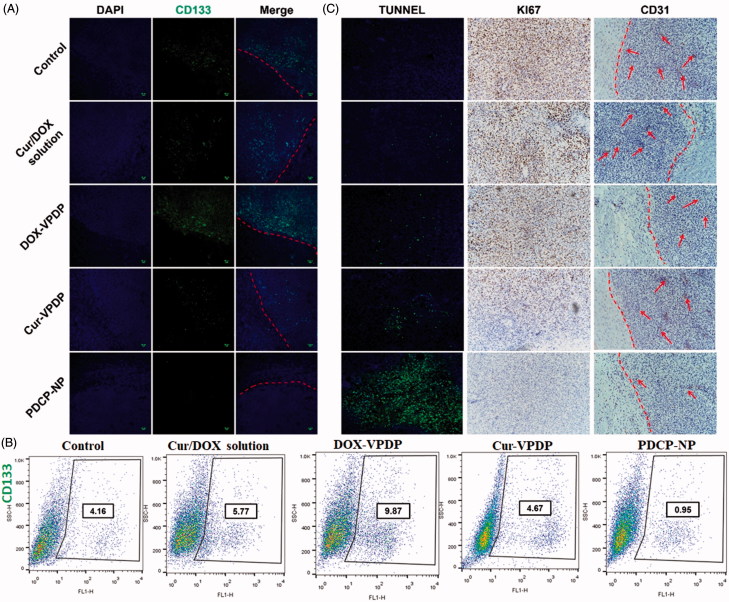
Figure 6.
(A) Immunofluorescence tissue staining and (B) the CSCs proportion within tumors after the tumor suppression study. (C) TUNEL assays of C6 glioma sections from rats receiving different therapies on day 28. Nuclei were stained blue while extracellular matrix and cytoplasm were stained red in HE staining. In TUNEL analyses, blue: cell nuclei stained by DAPI. Green: apoptotic cells. Immunohistochemical assays of Ki67, CD31 in tumor tissue. Red arrows highlight the immunohistochemical characteristics. Original magnification: 200×.

