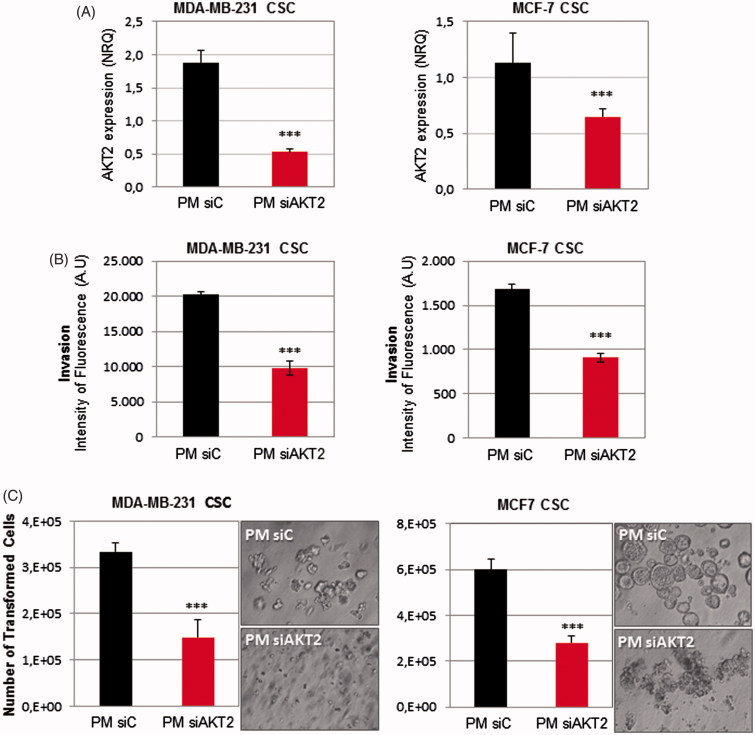
Figure 6.
PM-siAKT2 effects in MDA-MB-231 and MCF-7 CSC. (A): The reduction of AKT2 gene expression was detected in both cell lines through qPCR. The presented values are normalized to the housekeeping genes (Actin and GADPH). (B) Quantification of the number of invasive cells after incubation with PM-siAKT2 vs. PM-siC. (C) Quantification of the number of transformed cells after incubation with PM-siAKT2 vs. PM-siC. Colonies formation on the soft agar after incubation of cells with PM-siAKT2 vs. PM-siC. Results are expressed as mean ± sd (n = 3), ***p ≤ .001 for the comparison between PM-siC and PM-siAKT2. siControl is represented as siC.

