. 2015 Nov 18;5(1):312–317. doi: 10.1039/c5tx00343a

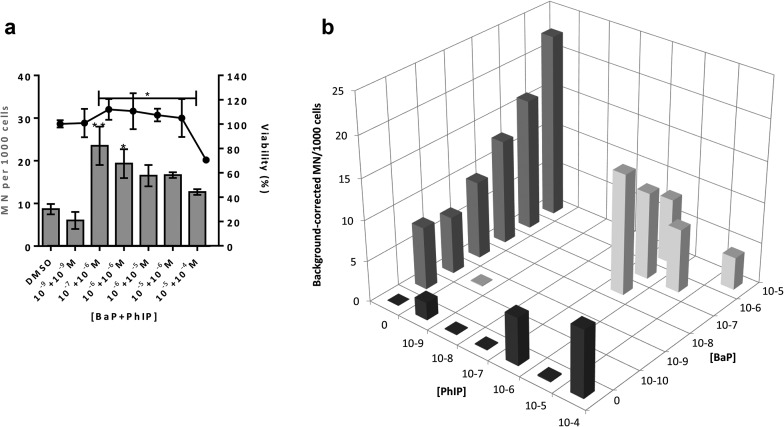
Fig. 3. (a) Cell viability and number of micronuclei (MN) per 1000 cells following a 24 hour exposure of spheroid cultures of MCF-7 cells to BaP/PhIP mixtures. (b) Background-corrected number of MN per 1000 cells following a 24 h exposure of spheroid cultures of MCF-7 cells to BaP/PhIP mixtures; in (b) black bars are MN values following exposure to PhIP, dark grey bars are MN values following exposure to BaP, light grey bars are MN values following exposure to the mixture. For all mixtures, the concentration of BaP is stated first. Data are means ± SEM, n = 2–3. Significance compared to DMSO control (one-way ANOVA with Dunnett's post-test; *P ≤ 0.05, **P ≤ 0.01).

Fig. 3