. 2016 May 17;5(4):1172–1181. doi: 10.1039/c6tx00084c

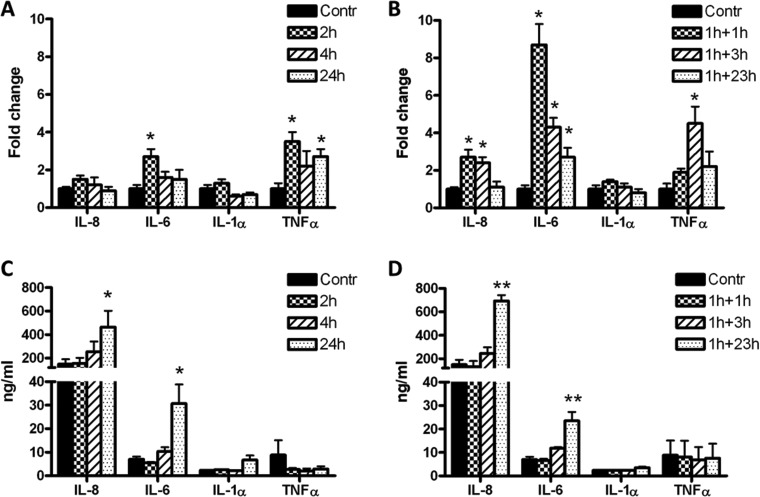
Fig. 1. Effects of PLTX on IL-8, IL-6, IL-1α and TNF-α gene expressions (A and B) and protein release in cell media (C and D). Cells were exposed to 1.0 × 10⁻¹¹ M PLTX for 2, 4 and 24 h (panels A and C) or to 1 h exposure to 1.0 × 10⁻¹¹ M PLTX followed by 1, 3 and 23 h culture in toxin-free medium (panels B and D). Gene expression data are expressed as the fold change with respect to the untreated sample specific mRNA considered as 1 (Kim et al. 2001)16 whereas protein release is expressed as ng mL–1 of each analyte released in cell media on the basis of the respective calibration curves and are the mean ± SE of three independent experiments performed in duplicate. Statistical differences: *, p < 0.05; **, p < 0.01 (one-way ANOVA).

Fig. 1