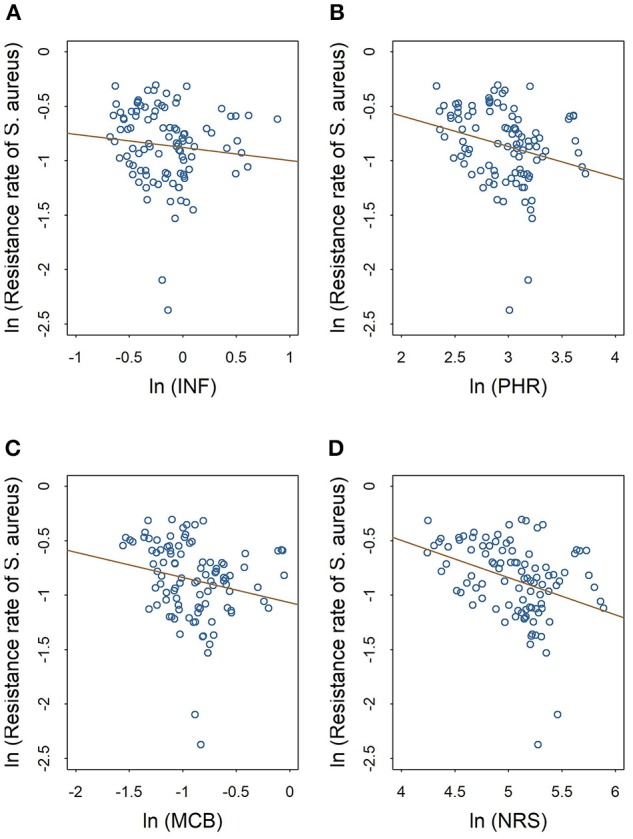
Figure 2.

Linear relationships between medical staffing and methicillin resistance rates of S. aureus. The red line in each plot denotes the fitted line. (A) The linear relationship between the staffing of infectious diseases physicians and the methicillin resistance rate of S. aureus. (B) The linear relationship between the staffing of pharmacists and the methicillin resistance rate of S. aureus. (C) The linear relationship between the staffing of clinical microbiologists and the methicillin resistance rate of S. aureus. (D) The linear relationship between the staffing of nurses and the methicillin resistance rate of S. aureus.
