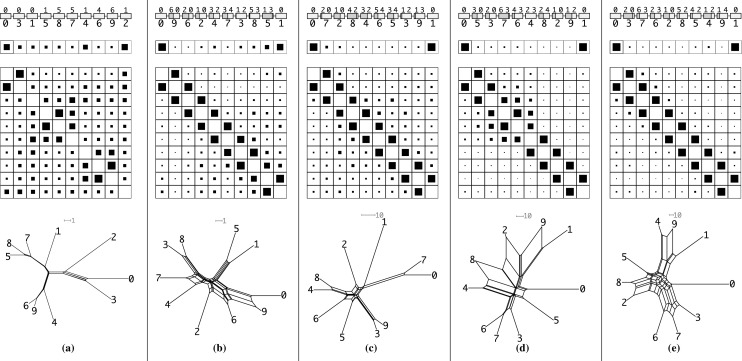
Fig. 6.

Examples of simulated gene clusters (see text for details). The mutation rate in the simulations are: in a, b 1%, in c 5%, in d 10%, in e 15%. Only in a local gene duplication events are employed as model while in b–e unequal crossing over events as proposed by Gehring’s model are used to create the cluster. Each column is a composite of four rows. In the first row the simulated cluster and its genes including their history is shown. Here, in the upper part the ancestral gene/genes are noted while on the bottom the simulated order is depicted. In the case of an unequal crossing over in Gehring’s model, the two parents are the number above the sequence block where the left number contributes the left (dark grey) part of the sequence and the right number the right part (light grey) of the sequence. In the second and third row the results of Gene-CluEDO are displayed. They are created with . The size of the black box in a cell is proportional to the likelihood of this cell. The second row shows the probability that a sequence is on the edge of the cluster. The third row gives the probability that two sequences are adjacent to each other in the cluster. The last row then shows the network that is created with the NeighborNet (Bryant et al. 2004, 2007) algorithm. Note that the NeighborNets may scale differently indicated by a grey scale bar. Evolutionary distances are computed with emboss 6.6 (Rice et al. 2000) and are expressed as the number of substitutions per 100 characters
