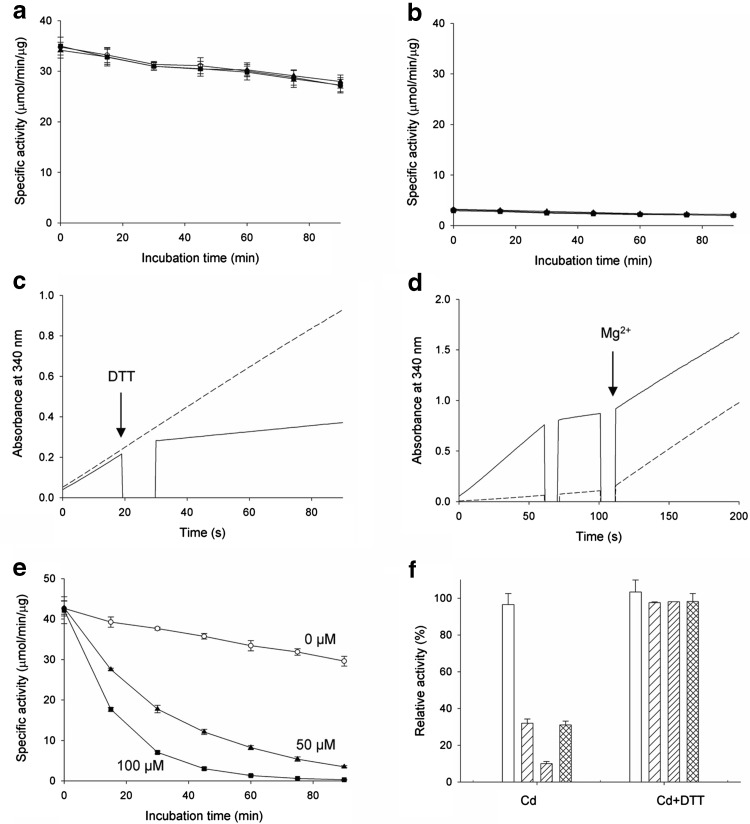
Fig. 4.
Recovery of mcIDH activity with reducing agents. a IDH, which was activated with Mg2+, was incubated with 0 μM (open circles), 50 μM (triangles), or 100 μM Cd2+ (squares), as in Fig. 3d, in the presence of 2 mM DTT. b IDH, which was activated with 50 μM (triangles), 100 μM (squares), or 500 μM Cd2+ (circles), was incubated in the presence of 2 mM DTT for up to 90 min. IDH activity was measured at 15-min intervals. c IDH activity was measured in the presence of Cd2+. Reduction of NADP+ by IDH with 50 μM Cd2+ was measured by monitoring the increase in absorbance at 340 nm (dashed line). At 20 s, 2 mM DTT was added and IDH activity measurement continued (solid line). d Recovery of inactivated IDH with Mg2+. IDH with Cd2+ was inactivated with DTT at 60 s as in (c), and 2 mM MgCl2 was added at 100 s (solid line). NADP+ reduction was monitored upon addition of 2 mM MgCl2 at 100 s in the absence of 50 μM Cd2+ (dashed line). e IDH, which was activated with Mg2+, was incubated with 0 μM (open circles), 50 μM (triangles), or 100 μM Cd2+ (squares), and IDH activity was measured in the presence of 2 mM DTT. f IDH activity was measured after a 0 min (open bars), 30 min (sparse line), and 60 min (heavy line) incubation with 100 μM Cd2+ in the absence (left) and presence (right) of 2 mM DTT. After a 30 min incubation with Cd2+, 2 mM DTT was added and further incubated for 30 min (crossed line)

