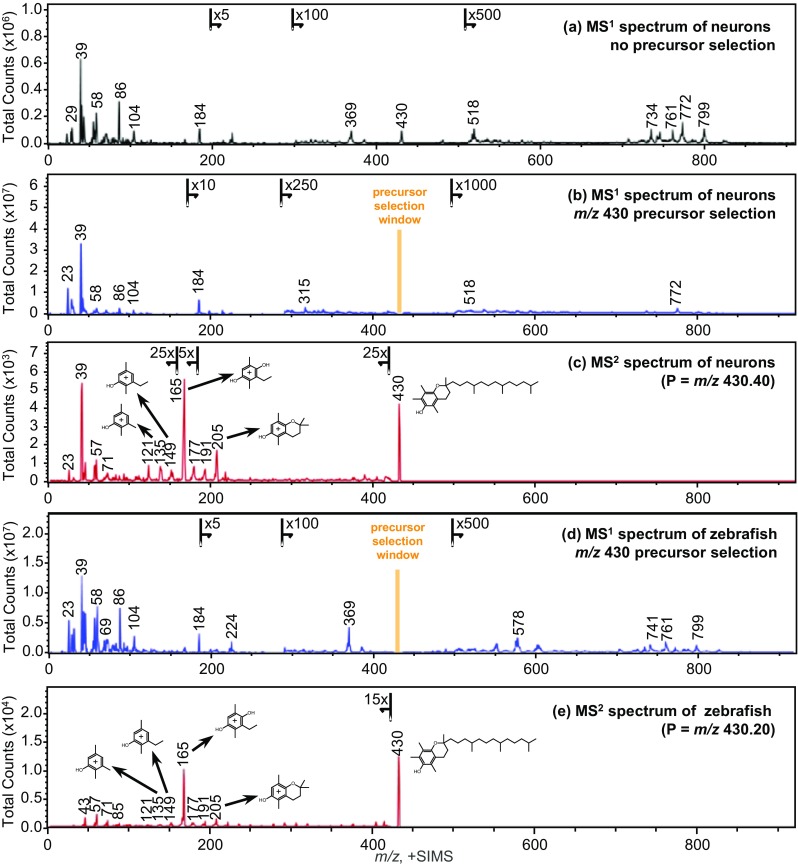
Figure 1.

Mass spectra collected by TOF-SIMS tandem MS imaging in the positive ion mode, plotted in the range of m/z 0–920. (a) An MS1 precursor ion spectrum acquired from a cell culture of human neuronal cells prior to the 3D analysis. (b) The MS1 precursor ion spectrum summed over the entire 3D analysis. The m/z 430.40 precursor peak is no longer present. The orange marker highlights the distorted portion of the spectrum surrounding the monoisotopic precursor selection window. (c) The MS2 product ion spectrum, with precursor selection centered at m/z 430.40, summed over the entire 3D analysis. Some of the characteristic product ions, and the precursor, are annotated with their tentative structures. (d) An MS1 precursor ion spectrum acquired from a thin tissue section of zebrafish infected with M. marinum bacteria. The m/z 430.20 precursor peak is no longer present, and the orange marker highlights the distorted portion of the spectrum surrounding the monoisotopic precursor selection window. (e) The MS2 product ion spectrum, with precursor selection centered at m/z 430.20. Some of the characteristic product ions, and the precursor, are annotated with their tentative structures
