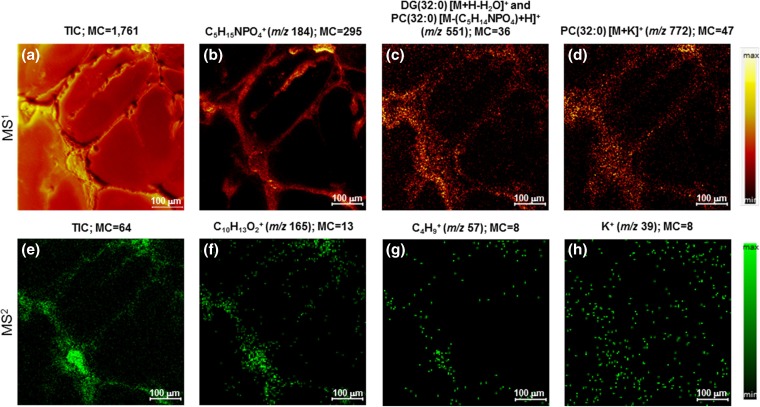
Figure 2.
TOF-SIMS tandem MS imaging of the human iPSC-derived neurons in the positive ion mode. The top row are MS1 images and the bottom row are MS2 images which were collected simultaneously during the in-depth voxel imaging analysis. The maximum counts per pixel are given in each panel. The ion images in the top row include the total ion count (TIC) (a), phosphocholine at m/z 184 (b), presumed phospholipid fragment ion and/or a diacyl glycerol ion with a total fatty acid composition of (32:0) at m/z 551 (c), and presumed [M+K]+ ion of PC(32:0) at m/z 772 (d) produced from the MS1 data. The ion images in the bottom row include the TIC (all product ions and unfragmented precursor ions) of α-tocopherol (e), the prominent C10H13O2+ product ion of α-tocopherol at m/z 165 (f), a minor product ion of α-tocopherol at m/z 57 (g), and a K+ product ion at m/z 39 (h). Note that the K+ ions are not localized to the cells only, but are more disbursed throughout the image area

