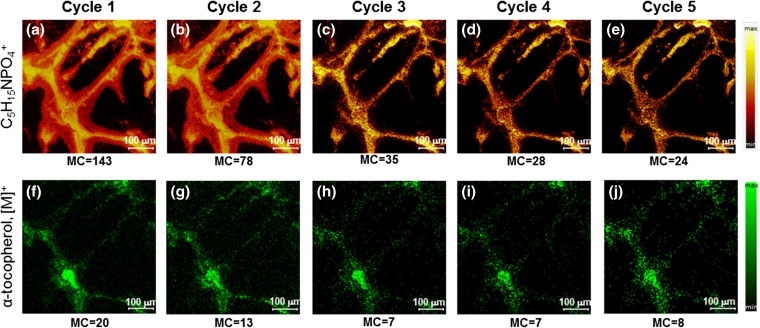
Figure 3.
3D TOF-SIMS tandem MS imaging of the human iPSC-derived neurons in the positive ion mode. Each 2D image in a row was extracted from the 3D image volume. The top row displays MS1 images of the phosphocholine head group (C5H15NPO4+), and the bottom row displays MS2 TIC images of a molecule identified as the [M]+ of α-tocopherol, as a function of sputtered depth. The MS1 and MS2 data were collected simultaneously. The maximum counts per pixel are given in each panel. The soma and neurites of the cell are clearly observed in both the MS1 and the MS2 images

