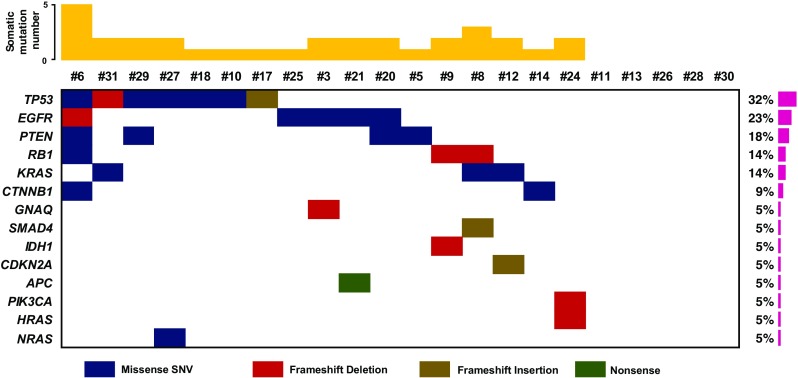
Fig. 5. Mutation profiling.

. Name of significantly mutated genes (left), distribution of mutations across 22 lung adenocarcinomas (middle), and frequency of significantly mutated genes (right) are plotted (bottom). Somatic mutation numbers are shown across patients (top)
