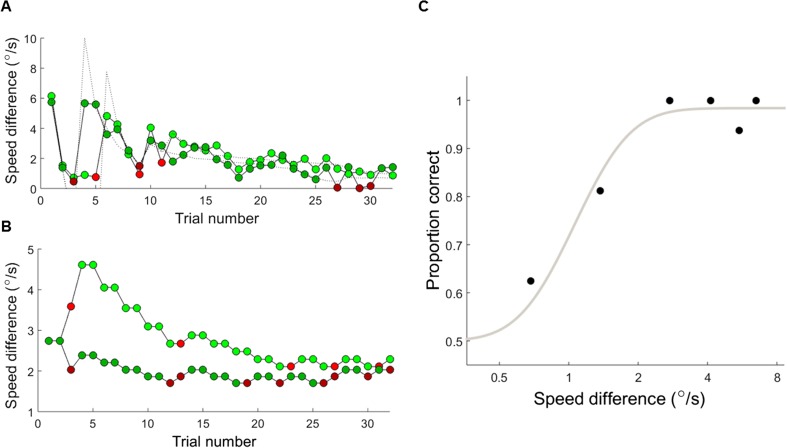
Fig. 2.
Example datasets for each psychophysical procedure. (A) Example dataset for the QUEST condition, belonging to a participant in the KS1 group. The speed difference is the difference between the comparison speed and the reference speed (1.5 °/s). The values suggested by the QUEST functions are shown as black dotted lines, and the presented values (after trimming within the allowable stimulus range and adding jitter) are shown as filled markers. Green markers indicate correct responses and red markers indicate incorrect responses. (B) Example dataset for the staircase condition, belonging to a participant in the KS1 group. As above, green markers indicate correct responses and red markers indicate incorrect responses. (C) Psychometric function fit to an example dataset for the MCS condition, in which the proportion of correct responses is plotted for each speed difference between the comparison and reference stimulus

