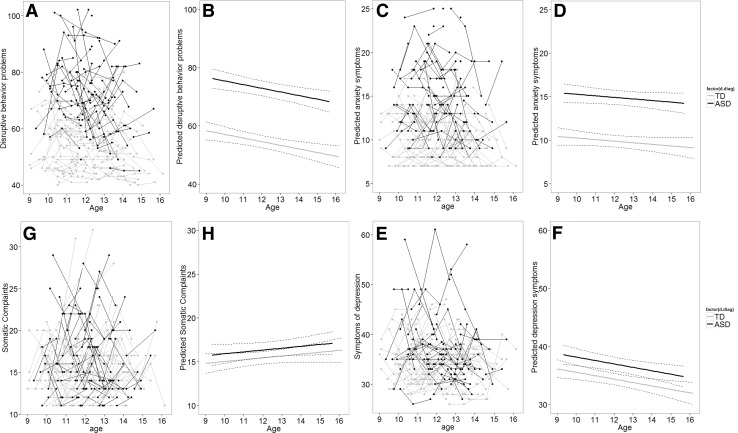
Fig. 1.
Longitudinal graphic representation of age at three time points and respectively internalizing and externalizing symptoms. a, c, e, g Participants are represented by individual lines. Participants measured only once are represented by points. b, d, f, h Predicted values for respectively internalizing, externalizing symptoms based on optimal fitting model

