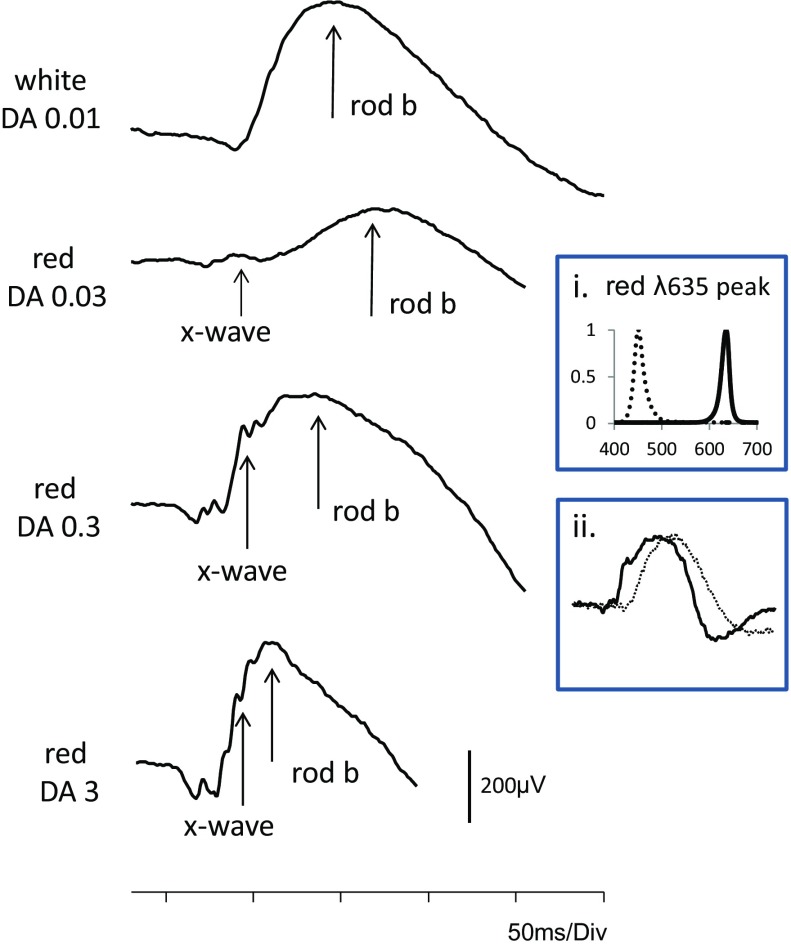
Fig. 1.
An ISCEV standard DA 0.01 ERG is shown at the top of the figure to compare the waveform of the rod driven b-wave with that of DA red flash ERGs produced by three different flash strengths of wavelength 635 nm after 20-min dark adaptation. Note the separation in peak time of the x-wave and b-wave to DA 0.03 cd s m−2 (dim) flashes, the enlargement of the x-wave to DA 0.3 cd s m−2 and the merging of x- and b-waves at DA 3 in a control subject. Insert i shows the spectral characteristics of the red (solid line) and blue (dotted line) LEDs in the Ganzfeld. Insert ii shows the DA red flash ERG to 0.3 cd s m−2 in a second subject compared with a DA blue flash ERG of “scotopically matched” b-wave amplitude, in this case DA blue 0.0003 cd s m−2 (the red flash response may also be “matched” to a DA dim white flash ERG). DA red ERG is shown as a solid black lines and DA blue flash ERG as a dotted line

