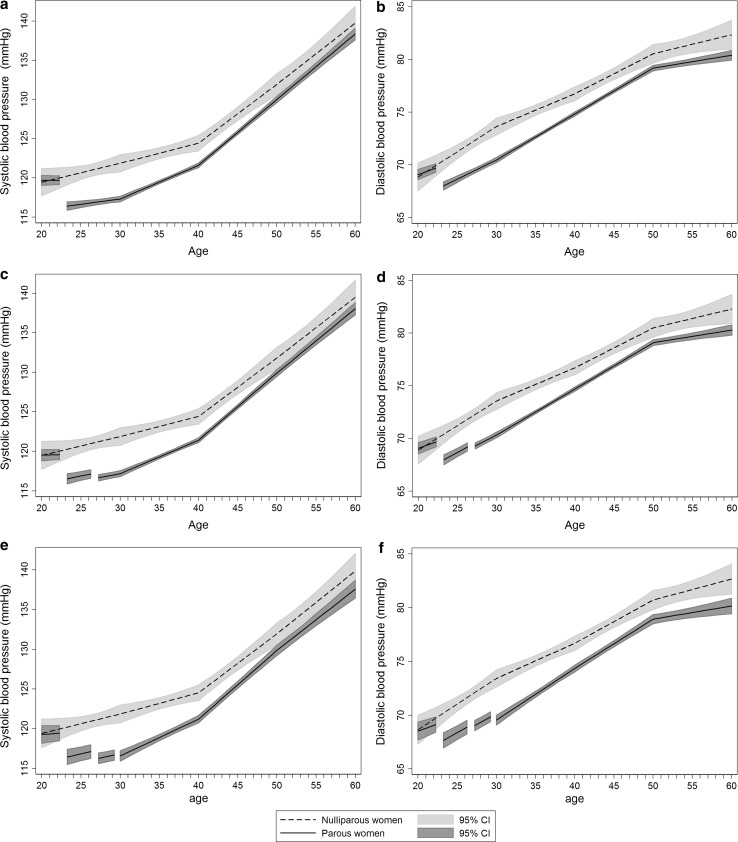
Fig. 2.
Mean systolic and diastolic blood pressure life course trajectories for nulliparous and parous women with one or more births (a and b), two or more births (c and d) and three or more births (e and f). Trajectories are drawn for women with covariates fixed at their means and with gaps in the graph of parous women corresponding to pregnancy and 3-month postpartum periods with the 1st birth at age 23, 2nd at 27 and 3rd at 30 years. Estimates are adjusted for age, HUNT survey, education and ever daily smoking

